1. Direct Characterization Methods
These methods enable direct visualization and quantitative analysis of CaCO₃ particle distribution, eliminating inference errors and providing the most definitive evidence of dispersion quality.
1.1 Transmission Electron Microscopy (TEM) – Nanoscale Dispersion Gold Standard
-
Core Applicability: Nano-CaCO₃ (primary particle size < 100 nm), capable of resolving single primary particles and nanoscale agglomerates.
-
Principle: A high-energy electron beam transmits through ultra-thin composite sections, generating contrast between high-density CaCO₃ and low-density polymer matrix to image particle morphology, agglomeration state, and spatial distribution.
-
Standard Test Protocol:
-
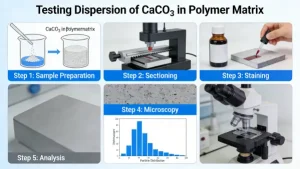
Sample Preparation (Critical for Accurate Results): Embed the polymer/CaCO₃ composite in epoxy resin and fully cure. Use a cryo-ultramicrotome with a diamond knife to cut 50–100 nm thick ultra-thin sections under liquid nitrogen cooling (to avoid polymer deformation and CaCO₃ particle detachment). Transfer sections to a carbon-coated copper grid.
-
Imaging: Operate the TEM at an accelerating voltage of 80–200 kV, collect bright-field images at magnifications of 10,000× to 100,000× acrossat least 10 random fields of view (FOVs)to eliminate sampling bias.
-
Data Analysis:
- Qualitative: Identify the presence of agglomerates, agglomerate size, and spatial homogeneity of particle distribution.
- Semi-quantitative: Use image analysis software (e.g., ImageJ) to measure the particle size distribution, average agglomerate size, and interparticle spacing of at least 500 particles; calculate the agglomerate ratio (area of agglomerates / total area of CaCO₃ particles).
-
-
Pros & Cons: Ultra-high nanoscale resolution; limited to local area analysis, with strict requirements for sample preparation.
1.2 Scanning Electron Microscopy (SEM) – Industrial Routine Quality Control Standard
-
Core Applicability: Micro-CaCO₃, high-filler loading systems, and rapid characterization of particle distribution (the most widely used method for industrial quality control).
-
Principle: Secondary electron imaging captures topographic and compositional contrast between CaCO₃ particles and the polymer matrix on the composite fracture surface.
-
Standard Test Protocol:
-
Sample Preparation:
- Cryo-fracture (Preferred): Immerse composite specimens in liquid nitrogen for 10–30 min for full cooling, then fracture rapidly to obtain a flat, plastic deformation-free cross-section.
- Optional Etching: Gently etch the fracture surface with a polymer-compatible solvent (e.g., xylene for PE, toluene for PS, decalin for PP) for 10–60 s to remove the surface polymer layer and expose embedded CaCO₃ particles; rinse with anhydrous ethanol and dry thoroughly.
- Conductive Coating: Sputter a 5–10 nm gold/platinum layer on the fracture surface to avoid charging effects.
-
Imaging: Operate the SEM at an accelerating voltage of 5–15 kV in secondary electron mode, collect images at magnifications of 500× to 50,000× across at least 10 random FOVs.
-
Data Analysis:
- Qualitative: Evaluate particle homogeneity, presence of large stress-concentrating agglomerates (>5 μm), and interfacial adhesion between CaCO₃ and the polymer matrix.
- Semi-quantitative: Statistically analyze the maximum/average agglomerate size, number of agglomerates per unit area, and dispersion uniformity.
-
-
Pros & Cons: Simple sample preparation, much larger FOV than TEM, excellent for industrial routine testing; cannot resolve single nano-CaCO₃ particles below 50 nm.
1.3 Small-Angle X-ray/Neutron Scattering (SAXS/SANS) – Quantitative Bulk Dispersion Characterization
-
Core Applicability: Nano-CaCO₃ (1–100 nm), for quantitative statistical analysis of bulk dispersion without local sampling bias (SAXS for routine research, SANS for high-contrast interfacial studies).
-
Principle: Incident X-rays/neutrons are scattered by electron density/scattering length density differences between CaCO₃ and the polymer matrix; the scattering pattern is fitted to obtain quantitative structural information of particles in the bulk composite.
-
Standard Test Protocol (SAXS as Example):
-
Sample Preparation: Fabricate the composite into a 0.5–2 mm thick flat sheet with no bubbles or defects.
-
Testing: Use a lab SAXS instrument or synchrotron radiation source, with incident X-ray wavelength of 0.1–0.15 nm, collect scattering data over a scattering vector q range of 0.01–5 nm⁻¹. Test the neat polymer matrix under identical conditions for background subtraction.
-
Data Analysis:
- Calculate the radius of gyration (Rg) via Guinier fitting: Rg significantly larger than the primary particle radius indicates severe agglomeration.
- Obtain particle size distribution and agglomerate fractal dimension (higher fractal dimension = denser, irreversible hard agglomerates) via model fitting (hard sphere model, fractal model).
- Quantify dispersion degree and spatial homogeneity of particles in the bulk.
-
-
Pros & Cons: Non-destructive, bulk characterization with unmatched statistical representativeness; high equipment cost, requires professional data fitting, insensitive to micron-scale particles.
1.4 Auxiliary Direct Methods
-
Optical Microscopy (OM): For rapid screening of large agglomerates (>1 μm) in 50–200 μm thick transparent composite films. Ultra-fast, low-cost, and non-destructive, but cannot resolve nanoscale particles or small agglomerates.
-
Atomic Force Microscopy (AFM): For nanoscale surface dispersion and interfacial interaction characterization, using tapping mode to collect height and phase images of composite films, distinguishing high-modulus CaCO₃ from low-modulus polymer matrix. Only characterizes the sample surface, not bulk dispersion.
-
Solvent Extraction & Sieving: Dissolve the polymer matrix completely with a compatible good solvent, sieve the CaCO₃ suspension with standard test sieves, and weigh the retained agglomerates to calculate the mass fraction of large agglomerates. Absolute quantitative measurement for industrial quality control, but only detects large agglomerates.
2. Indirect Characterization Methods
These methods infer the dispersion state of CaCO₃ by measuring property changes of the composite, which are directly correlated with particle dispersion. They are widely used for formulation optimization, processing parameter adjustment, and industrial performance validation, with standardized protocols from ISO and ASTM.
2.1 Rheological Characterization – Dispersion Evaluation Under Actual Processing Conditions
-
Core Principle: Well-dispersed CaCO₃ particles interact with polymer chains, restrict chain mobility, and alter the viscoelastic behavior of the polymer melt; agglomerates cause abrupt, predictable changes in rheological properties. This method is standardized byISO 6721-10:2025
andASTMD4440-23.
-
2.1.1 Dynamic Oscillatory Rheology (Rotational Rheometer, Most Commonly Used)
-
Test Protocol:
-
Sample Preparation: Melt-press the composite into a 25 mm diameter, 1–2 mm thick disk with a flat, bubble-free surface.
-
Testing: Use a parallel-plate fixture under nitrogen atmosphere (to prevent thermal degradation) at the polymer’s standard processing temperature.
- Step 1: Strain sweep at a fixed frequency (1 rad/s) to determine the linear viscoelastic (LVE) region.
- Step 2: Frequency sweep over an angular frequency range of 0.01–100 rad/s within the LVE region, to collect storage modulus (G’), loss modulus (G”), and complex viscosity (η*) as functions of frequency.
-
-
KeyDispersionCriteria (Identical Filler Loading):
- Low-frequency terminal region: Well-dispersed nano-CaCO₃ systems exhibit a solid-like plateau (G’ > G”) in the low-frequency region, with significantly higher modulus than the neat polymer. Poorly dispersed/agglomerated systems show no modulus plateau, with much lower modulus at the same filler loading.
- Viscosity behavior: Well-dispersed systems show gradual shear-thinning behavior; severely agglomerated systems have extremely high viscosity at low shear rates, with sharp viscosity drops as shear rate increases (agglomerate breakage).
- Quantitative analysis: Evaluate dispersion uniformity via Cole-Cole plots and van Gurp-Palmen plots; fit the scaling law of modulus to quantify the formation of a particle network.
-
2.1.2 Capillary Rheometry
-
Core Applicability: Simulate dispersion under high shear rates (10–10⁴ s⁻¹) during actual extrusion/injection molding.
-
Key Criteria: Poorly dispersed systems show extremely high apparent viscosity at low shear rates, with a steep viscosity drop at high shear rates; well-dispersed systems have a more gradual viscosity-shear rate dependence.
-
2.2 Mechanical & Dynamic Mechanical Analysis (DMA) – Macroscopic Performance Validation
-
Core Principle: The reinforcing and toughening effect of CaCO₃ is highly dependent on dispersion. Well-dispersed particles maximize mechanical performance, while agglomerates act as stress concentration points, leading to significant performance degradation.
-
2.2.1 Standard Mechanical Property Testing
-
Test Items & Dispersion Criteria (Identical Filler Loading & Processing Conditions):
-
Tensile Properties (ISO 527/ASTM D638): Higher tensile strength and elongation at break indicate better dispersion; severe agglomeration causes a sharp drop in elongation at break.
-
Impact Properties (ISO 180/ASTMD256): The toughening effect of nano-CaCO₃ is entirely dispersion-dependent. Well-dispersed systems show a substantial increase in impact strength, while agglomerates (>5 μm) lead to a drastic drop in impact strength, even below that of the neat polymer.
-
Flexural Properties (ISO 178/ASTMD790): Higher flexural strength and modulus indicate better dispersion, with agglomeration causing a decline in strength.
-
-
Key Note: Test at least 5 specimens per group to eliminate random errors.
-
-
2.2.2Dynamic Mechanical Analysis(DMA)
-
Core Applicability: Simultaneously evaluate dispersion and interfacial interactions, with higher sensitivity than standard mechanical testing.
-
Test Protocol: Test standard DMA specimens in dual cantilever/tension mode, with a heating rate of 2–5 °C/min, fixed frequency of 1 Hz, and strain within the LVE region, over a temperature range from -100 °C to 50 °C above the polymer’s glass transition temperature (Tg).
-
Key Criteria:
- Storage Modulus (E’): Better dispersion leads to significantly higher E’ both below and above Tg, compared to the neat polymer and poorly dispersed systems at the same loading.
- Glass Transition Temperature (Tg): Well-dispersed CaCO₃ with strong interfacial adhesion restricts polymer chain mobility, causing a slight increase in Tg; severe agglomeration results in no Tg shift or even a decrease.
- Loss Factor (tanδ): Better dispersion leads to a lower and broader tanδ peak (stronger interfacial energy dissipation); agglomerated systems have a tanδ peak close to that of the neat polymer.
-
2.3 Thermal Analysis
-
Differential Scanning Calorimetry(DSC): Well-dispersed CaCO₃ acts as a heterogeneous nucleating agent for polymer crystallization. Test the crystallization temperature (Tc) via a standard heat-cool-heat cycle: well-dispersed CaCO₃ significantly shifts Tc to higher temperatures (higher nucleation efficiency); severe agglomeration leads to minimal Tc increase.
-
Thermogravimetric Analysis (TGA): Verify actual CaCO₃ loading and evaluate macroscopic dispersion homogeneity via multi-point sampling. The relative deviation of ash content from multiple random sampling positions <5% indicates excellent macroscopic dispersion; larger deviations mean poor homogeneity.
3. Method Selection Guide
| Application Scenario | Recommended Test Methods |
| Industrial routine quality control | SEM (cryo-fracture) + Standard mechanical testing + Optical microscopy (pre-screening) |
| Nano-CaCO3 academic research | TEM + SAXS + Dynamic oscillatory rheology |
| Processing & formulation optimization | Capillary rheometry + Rotational rheometer |
| Macroscopic dispersion homogeneity validation | TGA multi-point ash test + Solvent extraction & sieving |
| Interfacial & dispersion synergistic characterization | AFM + DMA |
4. Critical Considerations for Accurate Dispersion Evaluation
-
Sampling Representativeness: All tests must use multiple random sampling positions and replicate specimens to avoid misjudgment caused by local sampling bias.
-
Combination of Methods: Always combine at least one direct characterization method with one indirect method for comprehensive and accurate dispersion evaluation (e.g., SEM + mechanical testing, TEM + rheology).
-
Variable Control: When comparing dispersion between samples, ensure identical filler loading, processing conditions, and sample preparation protocols, with only the dispersion modifier/process as the variable.
-
Soft vs. Hard Agglomerates: Soft agglomerates can be broken down by processing shear, while hard agglomerates are irreversible and severely degrade composite performance. TEM and SAXS can distinguish agglomerate compactness to differentiate soft and hard agglomerates.