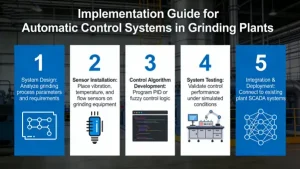
To implement automatic control for grinding plants effectively, follow a layered architecture with phased deployment, prioritizing stability first then optimization. This approach typically delivers 10-25% energy savings, 5-15% throughput gains, and improved product consistency.
1. System Architecture: Four-Tier Hierarchy
| Layer | Purpose | Key Components |
|---|---|---|
| Field Instrumentation | Real-time data acquisition | Sensors (load, level, pressure, flow, particle size), actuators (valves, VFDs, feeders) |
| Base Control | Basic regulatory control & safety | PLCs, DCS, HMI, safety interlocks |
| Advanced Process Control (APC) | Multivariable optimization | Model Predictive Control (MPC), fuzzy logic, expert systems |
| Intelligent Optimization | Adaptive & predictive control | AI/ML models, digital twins, soft sensors |
2. Key Components Selection
Sensors (Critical for Reliable Control)
| Parameter | Recommended Sensors | Installation Notes |
|---|---|---|
| Mill Load | MillSense (charge angle), power draw, acoustic sensors (electroacoustic) | Install at 30-45° from horizontal; avoid direct impact zones |
| Particle Size | PSI analyzer, laser diffraction, image analysis | Install on cyclone overflow; ensure proper sample conditioning |
| Slurry Density/Concentration | Nuclear density gauges, inline viscometers | Mount at least 3 pipe diameters from elbows; calibrate weekly |
| Flow Rates | Electromagnetic, Coriolis mass flowmeters | Full pipe flow required; avoid air entrainment |
| Level | Ultrasonic, radar, pressure transmitters | Install away from agitation; use non-contact for corrosive slurries |
Controllers & Software
- PLC/DCS: Rockwell PlantPAx, ABB 800xA, Siemens PCS 7 (redundant configuration recommended)
- APC Platform: ABB Expert Optimizer, Metso Grinding Optimizer, Pavilion8 (MPC engine)
- AI/ML Tools: IntelliSense.io, Wizata (for predictive maintenance & real-time optimization)
- Data Infrastructure: OPC UA for seamless integration; historian for process analysis (1-2 years data retention)
3. Implementation Roadmap: 6 Phases
Phase 1: Assessment & Planning (4-8 weeks)
- Audit existing process: map control loops, identify bottlenecks, document current KPIs
- Define objectives: throughput targets, particle size specs, energy reduction goals
- Conduct feasibility study: ROI analysis (typical payback: 6-18 months)
- Develop detailed project plan with clear milestones
Phase 2: Base Control System Upgrade (8-16 weeks)
- Install/replace critical sensors & actuators
- Implement PLC/DCS with standardized control logic:
- Mill load control: maintain optimal charge level (25-35% for SAG mills)
- Circuit stability: control sump levels, cyclone feed pressure, dilution water
- Safety interlocks: anti-overload, low lubrication, high temperature shutdowns
- Deploy HMI with trend displays, alarm management, and operator guidance
Phase 3: Advanced Control Implementation (12-20 weeks)
- Model Development:
- Steady-state process modeling (mass/energy balance)
- Dynamic identification tests (step changes to feed rate, water addition)
- MPC Strategy Design:
- Control variables: feed rate, mill speed, water addition, classifier speed
- Manipulated variables: feeder speeds, valve positions, VFD frequencies
- Constraints: max power, min particle size, sump level limits
- Soft Sensors:
- Estimate unmeasured variables (e.g., particle size using power + density)
- Implement using neural networks or regression models
Phase 4: Intelligent Optimization Layer (8-16 weeks)
- Deploy AI models for:
- Overload prediction: prevent mill plugging with 10-20 minute lead time
- Grindability adaptation: adjust setpoints for ore hardness variations
- Energy optimization: find minimum energy path to target fineness
- Implement digital twin for:
- What-if scenario testing
- Operator training
- Virtual commissioning
Phase 5: Commissioning & Tuning (6-10 weeks)
- Stage 1: Manual mode with monitoring (1-2 weeks)
- Stage 2: Auto mode with soft constraints (2-3 weeks)
- Stage 3: Full optimization with tight constraints (3-5 weeks)
- Fine-tune controllers using historical data and operator feedback
Phase 6: Validation & Handover (4-6 weeks)
- Performance testing against KPIs
- Operator training (focus on system monitoring, override procedures)
- Documentation: as-built drawings, control narratives, maintenance schedules
- Establish continuous improvement program (monthly performance reviews)
4. Control Strategies for Grinding Circuits
Basic Regulatory Control Loops
- Mill Load Control: Use power draw + acoustic sensors to adjust feed rate; prevents overloads and maximizes throughput
- Cyclone Overflow Density: Control dilution water flow to maintain target concentration (typically 35-45% solids)
- Sump Level Control: Manipulate pump speed or bypass valves to stabilize circuit operation
- Particle Size Control: Adjust classifier speed or mill power to maintain target P80 (80% passing size)
Advanced Multivariable Control (MPC)
MPC handles strong interactions between variables (e.g., feed rate affects both throughput and particle size):
- Economic Optimizer: Maximizes profit by balancing throughput, energy cost, and product quality
- Constraint Handling: Maintains operation within safe limits (power, bearing temperature, sump levels)
- Disturbance Rejection: Compensates for ore hardness variations, feed composition changes
AI-Enhanced Optimization
- Adaptive Setpoint Generation: Uses machine learning to find optimal setpoints for changing ore characteristics
- Predictive Maintenance: Monitors vibration, temperature, and power trends to predict bearing failures or liner wear
- Digital Twin Simulation: Tests new control strategies in virtual environment before plant implementation
5. Critical Success Factors
- Process Stability First: Ensure base control loops perform reliably (tight level control, stable flow rates) before implementing APC
- Operator Engagement: Train operators on new roles (data interpretation vs. manual adjustment); establish clear override protocols
- Data Quality Assurance:
- Implement sensor validation (cross-check power draw vs. acoustic signals)
- Establish regular calibration schedule (weekly for density gauges, monthly for particle size analyzers)
- Use data reconciliation to improve model accuracy
- Phased Deployment: Start with critical circuits (SAG mill first), then expand to ball mills and classification systems
- Performance Monitoring:
- Track KPIs: energy per ton, throughput, particle size distribution, availability
- Conduct weekly reviews to identify improvement opportunities
- Update control models quarterly as process conditions change
6. Implementation Example: SAG Mill Automation
-
Base Layer:
- Install load sensors (MillSense), power transducer, and flow meters
- Implement PLC control for feed rate, mill speed, and water addition
- Add safety interlocks for high bearing temperature and low lubrication pressure
-
Advanced Layer:
- Deploy MPC to coordinate feed rate, mill speed, and dilution water
- Use soft sensor to estimate particle size from power draw and density measurements
- Implement overload prediction model to reduce mill trips by 70%
-
Optimization Layer:
- AI model adjusts setpoints based on ore hardness (measured via online analyzer)
- Digital twin simulates different operating scenarios to maximize throughput while maintaining particle size specifications
7. Expected Benefits
| Metric | Typical Improvement |
|---|---|
| Energy Consumption | 10-25% reduction |
| Throughput | 5-15% increase |
| Product Quality | 20-40% reduction in particle size variation |
| Availability | 3-8% increase (fewer unplanned shutdowns) |
| Maintenance Costs | 10-15% reduction (predictive maintenance) |
8. Common Pitfalls to Avoid
- Underestimating Sensor Quality: Poor sensor data leads to ineffective control; invest in industrial-grade instruments
- Ignoring Process Dynamics: Grinding circuits have large time constants (5-30 minutes); allow sufficient settling time between setpoint changes
- Overcomplicating Initial Design: Start with basic control loops; add complexity incrementally
- Lack of Maintenance Plan: Sensors and actuators require regular calibration and cleaning (especially in abrasive environments)
- Inadequate Change Management: Resistance to automation is common; involve operators early and provide comprehensive training
Implementation Checklist
✅ Pre-Implementation
- Process audit completed with bottlenecks identified
- Clear objectives and KPIs defined
- Feasibility study with ROI calculation (target: <18 months)
- Cross-functional team formed (operators, engineers, management)
✅ Hardware Installation
- All critical sensors installed and calibrated
- Redundant controllers configured
- HMI with trend displays and alarm management deployed
- Safety interlocks tested and verified
✅ Software Configuration
- Base control logic implemented and tested
- MPC models developed and validated
- AI/ML components integrated with existing systems
- Data historian configured with 2-year retention
✅ Commissioning
- Base control loops tuned and stabilized
- APC activated with soft constraints
- Operators trained on new control philosophy
- Performance monitoring system operational