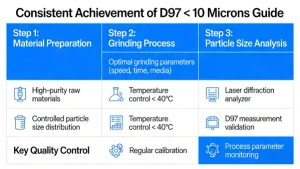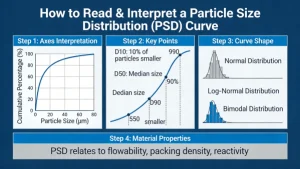
For mineral grinding (CaCO₃, graphite, etc.), the PSD curve is the most important chart to judge powder fineness & uniformity. Below is a step-by-step guide.
1. Basic Axes
- X-axis: Particle size (μm, nm)Usually logarithmic scale (common for powders).
- Y-axis:
- Cumulative distribution (%): % of particles smaller than a given size
- Differential (frequency): Volume/mass fraction at each size
2. Key Particle Sizes You Must Read
These are the industry standard values for grinding:
- D10: 10% of particles are finer than this size
- D50 (Median diameter): Midpoint of distribution → main indicator of fineness
- D90: 90% are finer → controls coarse particles
- D97: Used for quality control in many industrial minerals
How to read them:
Draw a horizontal line from the Y-axis percentage → intersect the cumulative curve → drop vertically to X-axis for the size.
3. Interpret Curve Shape
Cumulative curve
- Steep slope: Narrow distribution → particles are uniform
- Gentle slope: Wide distribution → mix of fine & coarse
Differential (frequency) curve
- Single sharp peak: Good grinding, uniform size
- Broad peak: Wide distribution
- Double peak: Often means agglomeration, incomplete dispersion, or mixed feeds
4. Practical Meaning for Mineral Grinding
- Smaller D50 = finer powder
- Small difference D90 – D10 = narrow, high-quality PSD
- High tail on the right (coarse side) = insufficient grinding
- Left-side tail (ultra-fine) = may cause agglomeration